How-To GuidesStatistics
Statistics
Track revenue, order volume, and business trends over time.
Overview
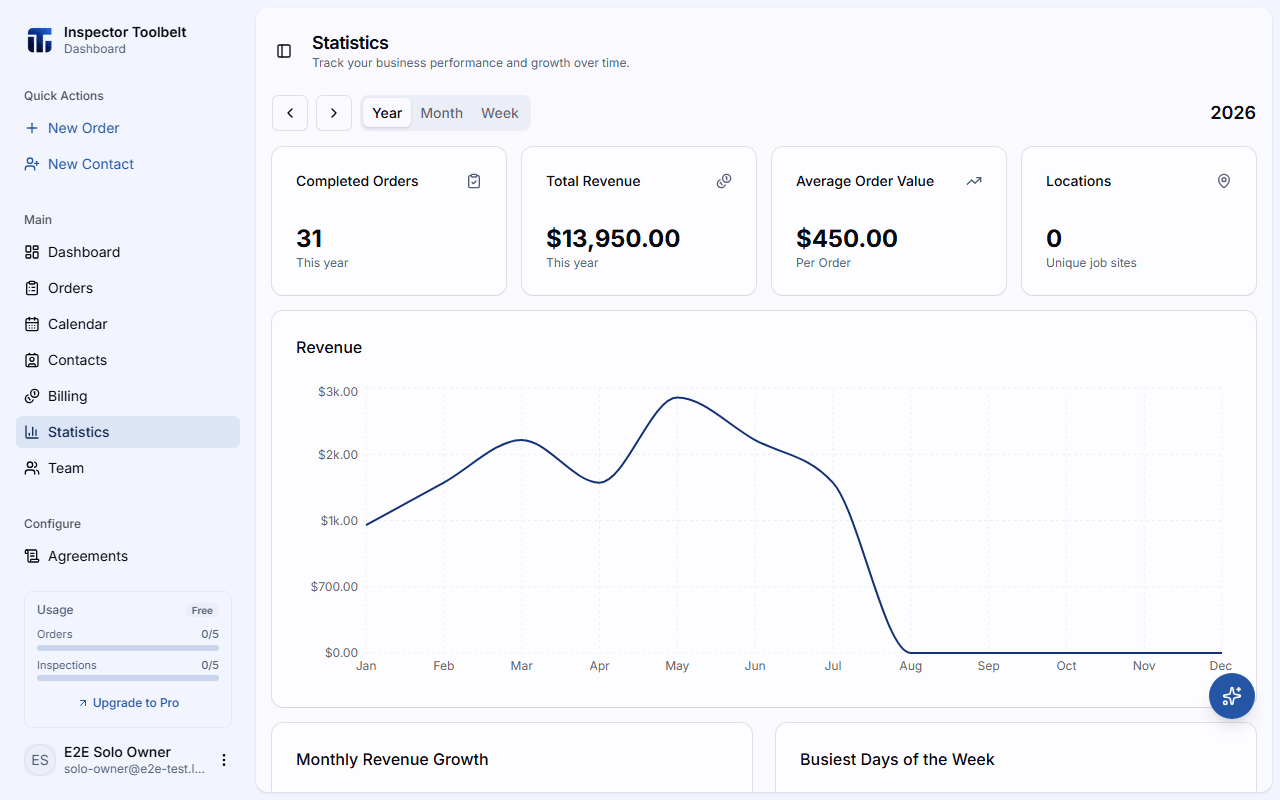
The Statistics page turns your completed Orders and payments into charts so you can spot trends in revenue and workload. Data is tracked automatically — no setup required.
Click Statistics in the sidebar to open it.
Choosing a Time Range
Use the Week, Month, and Year tabs at the top to change the period, and the previous/next arrows to step through time. Every card and chart updates to match.
Key Metrics
The cards at the top summarize the selected period:
| Metric | Meaning |
|---|---|
| Completed Orders | Number of Orders completed |
| Total Revenue | Revenue collected |
| Average Order Value | Revenue divided by completed Orders |
| Locations | Unique Property locations served |
Charts
- Revenue — revenue over time (daily, weekly, or monthly depending on the range)
- Monthly Revenue Growth — month-over-month growth (Year view)
- Busiest Days of the Week — which days carry the most work
- Referral Sources — where your business comes from
- Team Orders and Team Revenue — per-member breakdowns when you have a team
Nothing showing yet?
Statistics appear once you start completing Orders and receiving payments. Until then you'll see an empty state.